Understanding Technical Analysis : Moving Average Convergence Divergence (MACD)

Apart from candlestick chart pattern indicators, traders or analysts often use the Moving Average Convergence Divergence (MACD) and Relative Strength Index (RSI) in technical analysis of financial security. Like the candlestick chart indicators, MACD is also used to identify any trend pattern movement.
What is MACD?
Momentum Oscillator
- MACD is a momentum oscillator indicator which is used to identify trend formation
Moving Averages
- MACD shows a relationship between two moving averages of a financial instrument.
- It combines price points of an instrument over a specified time frame, divided by the number of data points, to give a single trend line
| Simple Moving Average (SMA) | Exponential Moving Average (EMA) |
|---|---|
| The most basic MA, which is just a straight calculation of the mean price of a set of values over a given time periods. | A type of moving average that gives more weight to recent prices which involves three steps. |
| If you were to calculate the SMA for a ten-day period, you would take the summed value of the last ten days and divide the result by ten. | The SMA is computed first. Next, we must calculate the multiplier for weighting the EMA. The final step involves the use of formula to compute the current EMA. |
How MACD works?
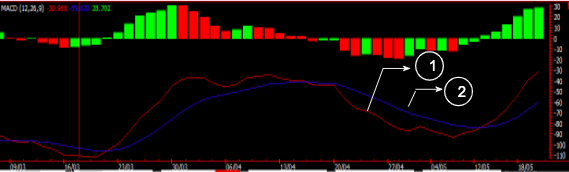
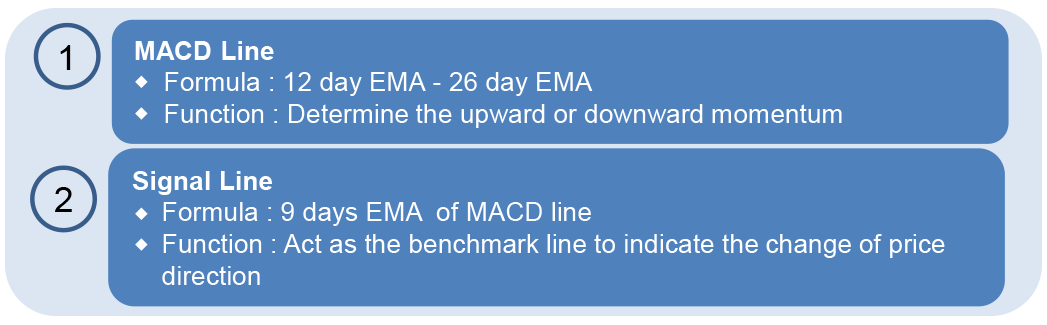
MACD is generated by subtracting the long term EMAs (26 period) from the short term EMAs (12 periods) to form the main line known as MACD line. This MACD line will eventually be used to create another line known as the signal line.
How to read MACD?
MACD is a momentum oscillator indicator which is used to identify trend formation. As MACD shows a relationship between two moving averages, any trading signal or indication from MACD usually observed through two techniques, MACD crossover or MACD divergence.
MACD Crossover
MACD can be read when the two lines cross over each other

Bullish Crossover
When the MACD line crosses above the signal line, it triggers a bullish signal and shows a signal for traders to buy the financial instrument.

Bearish Crossover
When the MACD line crosses below the signal line, it triggers a bearish signal and shows a signal for traders to sell the financial instrument.
MACD Divergence
Divergence is when the MACD line forms highs or lows that diverge from the corresponding high and low of the financial instrument’s price. In other words, divergence occurs when the MACD lines contradict with the price movement of the financial instruments.
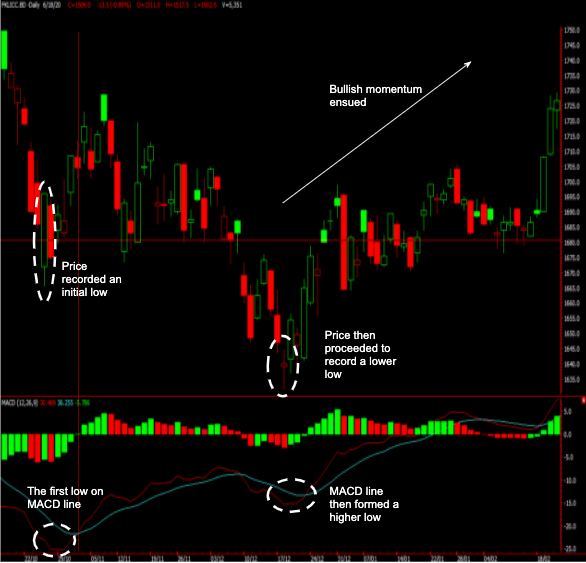
Bullish Divergence
A bullish divergence occurs when the MACD line forms a low followed by a higher low to indicate the upward momentum. At the same time, the price of the financial instrument forms a low followed by a lower low.
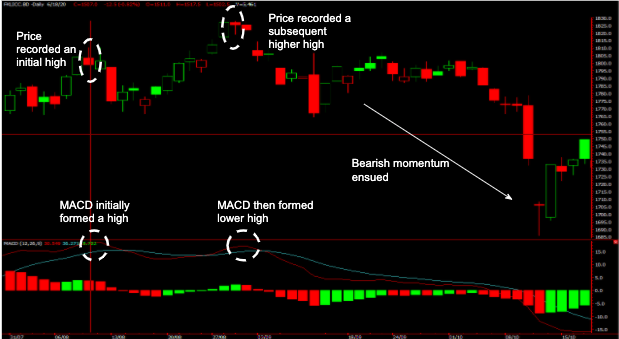
Bearish Divergence
A bearish divergence occurs when the MACD forms a high followed by a lower high to indicate the downward momentum. At the same time, the price of the financial instrument is forms a high followed by a higher high.
Download full article here
Disclaimer:
This document has been prepared solely for the use of the recipient. No part of this publication may be reproduced, stored in a retrieval system, or transmitted in any form or by any means without the prior written permission from Kenanga Futures Sdn Bhd. Although care has been taken to ensure the accuracy of the information contained herein, Kenanga Futures Sdn Bhd does not warrant or represent expressly or impliedly as to the accuracy or completeness of the information. This information does not constitute financial or trading advice; neither does it make any recommendation regarding product(s) mentioned herein. Kenanga Futures Sdn Bhd does not accept any liability for any trading and financial decisions of the reader or third party on the basis of this information. All applicable laws, rules, and regulations, from local and foreign authorities, must be adhered to when accessing and trading on the respective markets.